Points re-valued: every All Blacks scorer at today's scoring values, and adjusted for era
A try was worth three points until 1971 and four until 1992. Re-scored at today's values and measured against the scoring of each era, Fergie McCormick, Don Clarke and Grant Fox carried more of the All Blacks' scoring than anyone, and Andrew Mehrtens and Dan Carter are dead level per Test.
Thursday, 5 November 2026
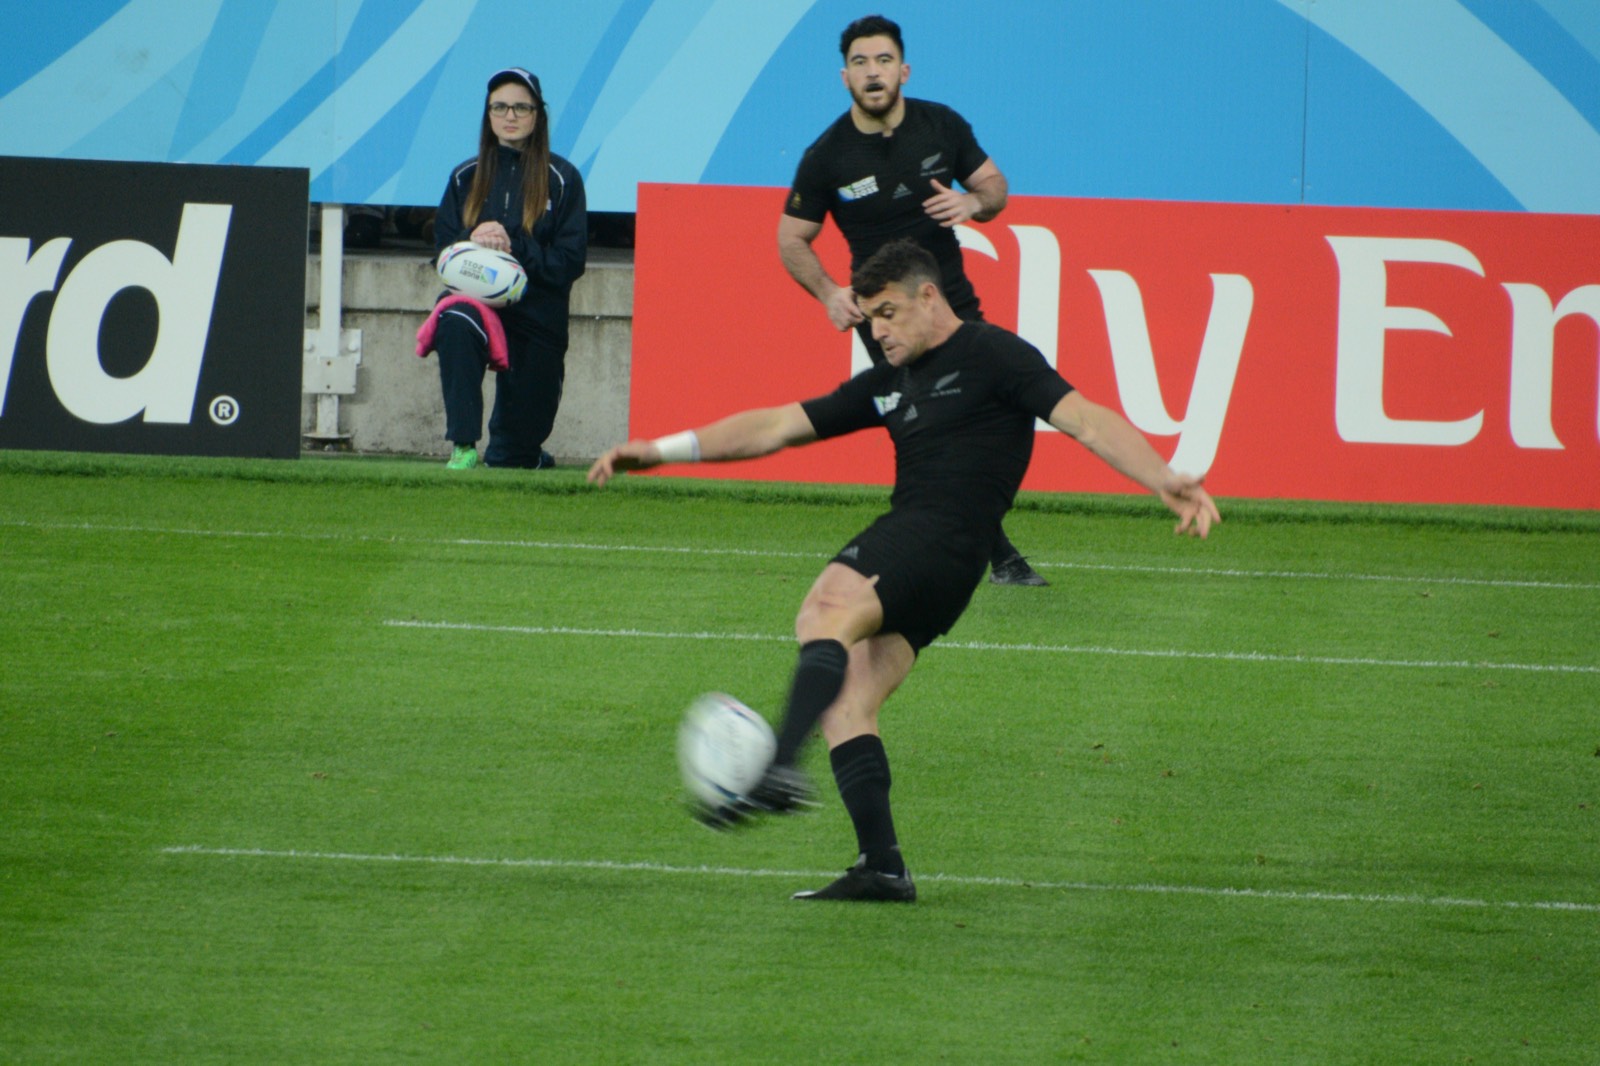
Dan Carter scored 1,598 points for the All Blacks, more than anyone in the history of Test rugby when he retired. But points have not always been worth what they are worth now. A try was three points until 1971 and four until July 1992; a drop goal was four until 1948; there was a goal from a mark until 1977. And the game has changed shape: the All Blacks scored about 11 points a Test in the 1950s and about 36 now. This is every All Blacks points-scorer, re-valued at today's scoring and measured against his own era.
How the scoring changed
| Period | Try | Conversion | Penalty | Drop goal | Goal from a mark |
|---|---|---|---|---|---|
| 1903-1905 | 3 | 2 | 3 | 4 | 4 |
| 1905-1948 | 3 | 2 | 3 | 4 | 3 |
| 1948-1971 | 3 | 2 | 3 | 3 | 3 |
| 1972 to June 1992 | 4 | 2 | 3 | 3 | none after 1977 |
| From 4 July 1992 | 5 | 2 | 3 | 3 | none |
New Zealand Rugby's records first count a five-point try in the Test against Australia on 4 July 1992; the five Tests earlier that year were still played under four-point tries.
| Decade | Tests | All Blacks tries per Test | All Blacks points per Test |
|---|---|---|---|
| 1900s | 14 | 4.14 | 16.7 |
| 1910s | 10 | 4.9 | 18.9 |
| 1920s | 14 | 2.14 | 10.4 |
| 1930s | 22 | 2.91 | 14.8 |
| 1940s | 10 | 1.9 | 12.8 |
| 1950s | 30 | 2.0 | 11.5 |
| 1960s | 42 | 2.33 | 14.6 |
| 1970s | 45 | 1.91 | 14.4 |
| 1980s | 57 | 3.19 | 25.6 |
| 1990s | 92 | 3.93 | 33.6 |
| 2000s | 122 | 4.31 | 36.4 |
| 2010s | 133 | 4.62 | 36.1 |
| 2020s | 82 | 4.89 | 35.6 |
Two adjustments
- Points at today's values. We re-scored every try, conversion, penalty, drop goal and goal from a mark in All Blacks history at today's values. It changes the totals of try-scorers, not kickers.
- Era-adjusted points per Test. A player's points per Test at today's values, scaled by how many points the All Blacks scored per Test in his decades compared with today. A kicker who scored seven points a Test in the 1960s, when the whole team scored 15, was carrying a far bigger share of the scoring than one who scores seven now.
We also show the share of team points: of all the points the All Blacks scored in the Tests a player played, how many were his.
The leading points-scorers
| Player | Years | Tests | Tries | Conversions | Penalties | Drop goals | Points as scored | At today's values | Per Test | Era-adjusted per Test | Share of team points |
|---|---|---|---|---|---|---|---|---|---|---|---|
| Dan Carter | 2003-2015 | 112 | 29 | 293 | 281 | 8 | 1598 | 1598 | 14.3 | 14.1 | 39.8% |
| Andrew Mehrtens | 1995-2004 | 70 | 7 | 169 | 188 | 10 | 967 | 967 | 13.8 | 14.2 | 38.9% |
| Beauden Barrett | 2012-2026 | 147 | 48 | 198 | 66 | 3 | 843 | 843 | 5.7 | 5.7 | 16.0% |
| Grant Fox | 1985-1993 | 46 | 1 | 118 | 128 | 7 | 645 | 646 | 14.0 | 16.7 | 46.2% |
| Richie Mo'unga | 2018-2026 | 57 | 11 | 143 | 41 | 0 | 464 | 464 | 8.1 | 8.2 | 21.3% |
| Damian McKenzie | 2016-2026 | 83 | 24 | 93 | 39 | 0 | 423 | 423 | 5.1 | 5.1 | 13.6% |
| Aaron Cruden | 2010-2017 | 50 | 5 | 63 | 56 | 1 | 322 | 322 | 6.4 | 6.4 | 19.3% |
| Jordie Barrett | 2017-2026 | 86 | 26 | 49 | 26 | 0 | 306 | 306 | 3.6 | 3.6 | 9.7% |
| Carlos Spencer | 1997-2004 | 35 | 14 | 49 | 41 | 0 | 291 | 291 | 8.3 | 8.4 | 21.7% |
| Will Jordan | 2020-2026 | 63 | 56 | 0 | 0 | 0 | 280 | 280 | 4.4 | 4.5 | 12.6% |
| Doug Howlett | 2000-2007 | 62 | 49 | 0 | 0 | 0 | 245 | 245 | 4.0 | 3.9 | 10.0% |
| Christian Cullen | 1996-2002 | 58 | 46 | 3 | 0 | 0 | 236 | 236 | 4.1 | 4.2 | 10.3% |
| Jeff Wilson | 1993-2001 | 60 | 44 | 1 | 3 | 1 | 234 | 234 | 3.9 | 4.1 | 9.8% |
| Joe Rokocoko | 2003-2010 | 68 | 46 | 0 | 0 | 0 | 230 | 230 | 3.4 | 3.3 | 10.1% |
| Julian Savea | 2012-2017 | 54 | 46 | 0 | 0 | 0 | 230 | 230 | 4.3 | 4.2 | 12.3% |
| Don Clarke | 1956-1964 | 31 | 2 | 33 | 38 | 5 | 207 | 211 | 6.7 | 17.9 | 51.5% |
| Allan Hewson | 1981-1984 | 19 | 4 | 22 | 43 | 4 | 201 | 205 | 10.6 | 15.1 | 55.1% |
| Rieko Ioane | 2016-2026 | 91 | 40 | 0 | 0 | 0 | 200 | 200 | 2.2 | 2.2 | 6.2% |
| Ben Smith | 2009-2019 | 84 | 39 | 0 | 0 | 0 | 195 | 195 | 2.3 | 2.3 | 6.5% |
| Jonah Lomu | 1994-2002 | 63 | 37 | 0 | 0 | 0 | 185 | 185 | 2.9 | 3.0 | 8.1% |
Who gains most at today's values
| Player | Years | Tests | Tries | Points as scored | At today's values | Gain |
|---|---|---|---|---|---|---|
| John Kirwan | 1984-1994 | 63 | 35 | 143 | 175 | +32 |
| Ian Kirkpatrick | 1967-1977 | 39 | 16 | 57 | 80 | +23 |
| Frank Mitchinson | 1907-1913 | 11 | 10 | 32 | 52 | +20 |
| Stu Wilson | 1977-1983 | 34 | 19 | 76 | 95 | +19 |
| Kelvin Tremain | 1959-1968 | 38 | 9 | 27 | 45 | +18 |
| Terry Wright | 1986-1991 | 30 | 18 | 72 | 90 | +18 |
| Ralph Caulton | 1959-1964 | 16 | 8 | 24 | 40 | +16 |
| Dick Roberts | 1913-1914 | 5 | 7 | 29 | 43 | +14 |
| George Hart | 1930-1936 | 11 | 7 | 21 | 35 | +14 |
| Ron Jarden | 1951-1956 | 16 | 7 | 42 | 56 | +14 |
| Colin Meads | 1957-1971 | 55 | 7 | 21 | 35 | +14 |
| Tony Steel | 1966-1968 | 9 | 7 | 21 | 35 | +14 |
John Kirwan gains most: his 35 tries were worth four points each, and at today's values his total rises from 143 to 175. Ian Kirkpatrick's 16 tries, scored at three points, are worth 80 points today instead of 57. Colin Meads, who scored seven tries, goes from 21 points to 35.
The ranking: points per Test, adjusted for era
Players with at least 15 Tests and 100 points.
| Rank | Player | Years | Tests | Points | Per Test | Era-adjusted per Test | Share of team points |
|---|---|---|---|---|---|---|---|
| 1 | Fergie McCormick | 1965-1971 | 16 | 121 | 7.6 | 18.6 | 48.4% |
| 2 | Don Clarke | 1956-1964 | 31 | 207 | 6.7 | 17.9 | 51.5% |
| 3 | Grant Fox | 1985-1993 | 46 | 645 | 14.0 | 16.7 | 46.2% |
| 4 | Allan Hewson | 1981-1984 | 19 | 201 | 10.6 | 15.1 | 55.1% |
| 5 | Andrew Mehrtens | 1995-2004 | 70 | 967 | 13.8 | 14.2 | 38.9% |
| 6 | Dan Carter | 2003-2015 | 112 | 1598 | 14.3 | 14.1 | 39.8% |
| 7 | Tony Brown | 1999-2001 | 18 | 171 | 9.5 | 9.7 | 22.1% |
| 8 | Carlos Spencer | 1997-2004 | 35 | 291 | 8.3 | 8.4 | 21.7% |
| 9 | Richie Mo'unga | 2018-2026 | 57 | 464 | 8.1 | 8.2 | 21.3% |
| 10 | Kieran Crowley | 1985-1991 | 19 | 105 | 5.5 | 7.0 | 24.2% |
| 11 | Aaron Cruden | 2010-2017 | 50 | 322 | 6.4 | 6.4 | 19.3% |
| 12 | Nick Evans | 2004-2007 | 16 | 103 | 6.4 | 6.3 | 14.5% |
| 13 | Beauden Barrett | 2012-2026 | 147 | 843 | 5.7 | 5.7 | 16.0% |
| 14 | Damian McKenzie | 2016-2026 | 83 | 423 | 5.1 | 5.1 | 13.6% |
| 15 | Luke McAlister | 2005-2009 | 30 | 153 | 5.1 | 5.0 | 14.7% |
What the numbers say
Fergie McCormick and Don Clarke come out on top, and they were the most important scorers the All Blacks have had. Clarke, the giant Waikato fullback of 1956 to 1964, scored more than half of all the All Blacks' points in the Tests he played. McCormick, the Canterbury fullback, scored 48 percent of the team's points in his 16 Tests. In the low-scoring rugby of their time, the All Blacks often won because of their boots.
Grant Fox is the best of the modern kickers on this measure, ahead of Andrew Mehrtens and Dan Carter. Fox scored 14 points a Test between 1985 and 1993, when the All Blacks averaged between about 26 and 34; Carter scored about the same per Test in an era when the team averaged 36. Fox scored 46 percent of the team's points in his Tests, Mehrtens 39 percent and Carter 40 percent.
Allan Hewson, the fullback of 1981 to 1984, is fourth, with 201 points in 19 Tests and 55 percent of the team's points, the highest share of anyone in the table.
Mehrtens and Carter are almost level. Mehrtens scored 967 points in 70 Tests, 13.8 a Test; Carter 1,598 in 112, 14.3 a Test. Adjusted for era, there is nothing between them. Carter's career total is the greater achievement because he sustained it over 112 Tests; per Test, they were equally prolific.
The modern backs who score tries rather than kick goals, from Will Jordan to Christian Cullen, score between four and four and a half points a Test. Beauden Barrett, with 843 points from 147 Tests, has the third-highest total in All Blacks history; he has kicked fewer goals than the specialists because he has spent much of his career at fullback.
Records in a single Test
Simon Culhane scored 45 points against Japan in Bloemfontein at the 1995 World Cup, a try and 20 conversions, still the All Blacks record. Tony Brown scored 36 against Italy in 1999. Carlos Spencer, Andrew Mehrtens, Dan Carter (against the 2005 Lions) and Nick Evans have each scored 33.
Sources: New Zealand Rugby, All Blacks statistics (stats.allblacks.com), scorers for every Test 1903-2026, reconciled against every final score; World Rugby laws history; RUGBE analysis.
🗳️ Who is the greatest All Blacks goalkicker?
Everyone can vote, no sign-in needed.
🗳️ Is a five-point try good for the game?
Everyone can vote, no sign-in needed.
Sources & further reading
This story draws on the reporting below. The original journalism deserves your click.
- All Blacks statistics: line-ups and scorers for every Test , New Zealand Rugby
- All Blacks player profiles , New Zealand Rugby
- List of New Zealand rugby union Test matches , Wikipedia
Comments (0)
Sign in to join the conversation.